

Invited Speakers
This list includes all invited speakers, along with their titles, descriptions, dates, locations, bios, and optional photos. It will be updated regularly.
==========================================
Read more below
==========================================
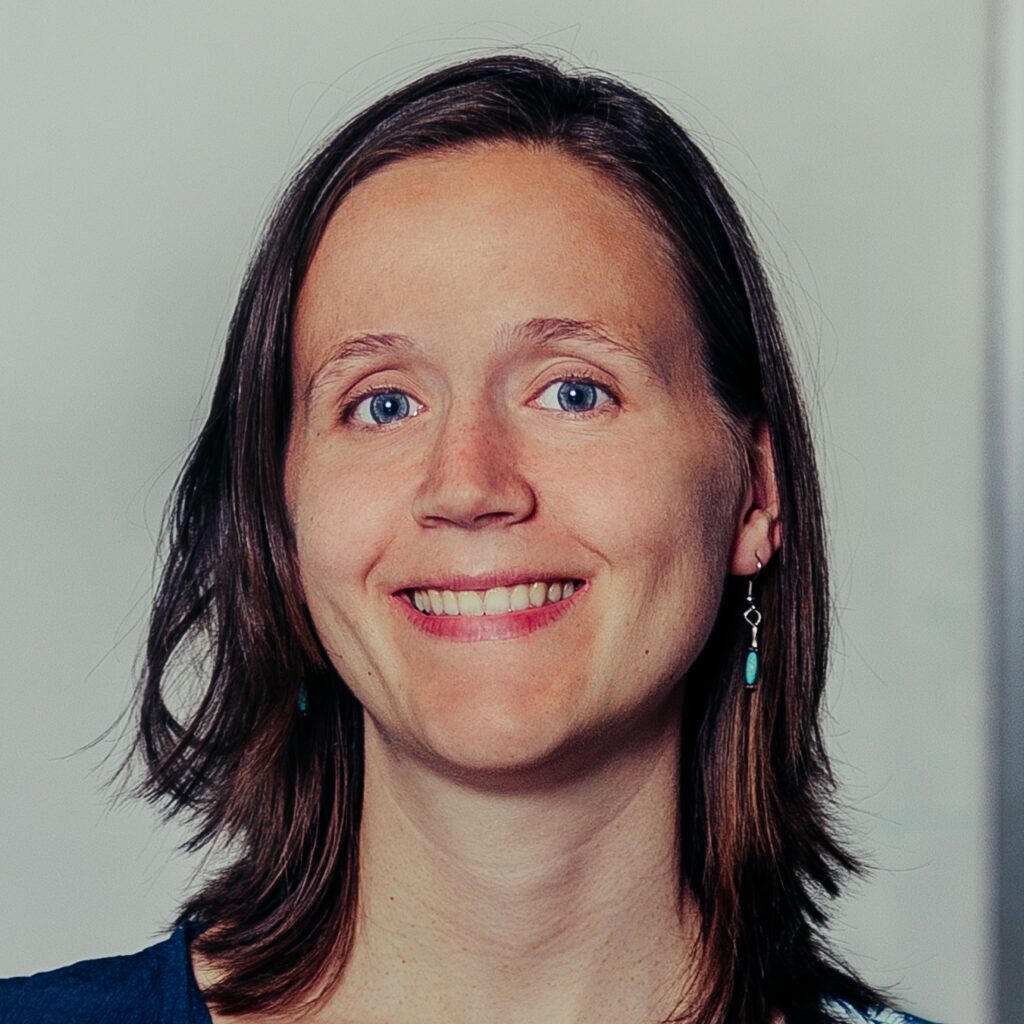
Title: Passenger forecasting for the Dutch Railways
Date: 24-Mar-2026 at 15:15
Location: BBG 1.61
Abstract: At NS (the Dutch railway company), they want to offer the best possible products and services based on expected demand. Forecasts of passenger flows are a vital source of information within many applications throughout the company: from offering lower-price tickets in quiet trains to ordering the right amount of new trains for the future. In this talk, I will explain what type of forecasting methodologies we use and what challanges we face with implementing these in production.
Affiliation: Nederlandse Spoorwegen (NS)
Bio: Dafne van Kuppevelt works as a Data Scientist at NS (Dutch railway). She studied Mathematics and Computer science at Utrecht University. Before NS, she worked as Data Scientist at ING and as Research Software Engineer at the eScience Center, supporting academic researchers with data science and software development.
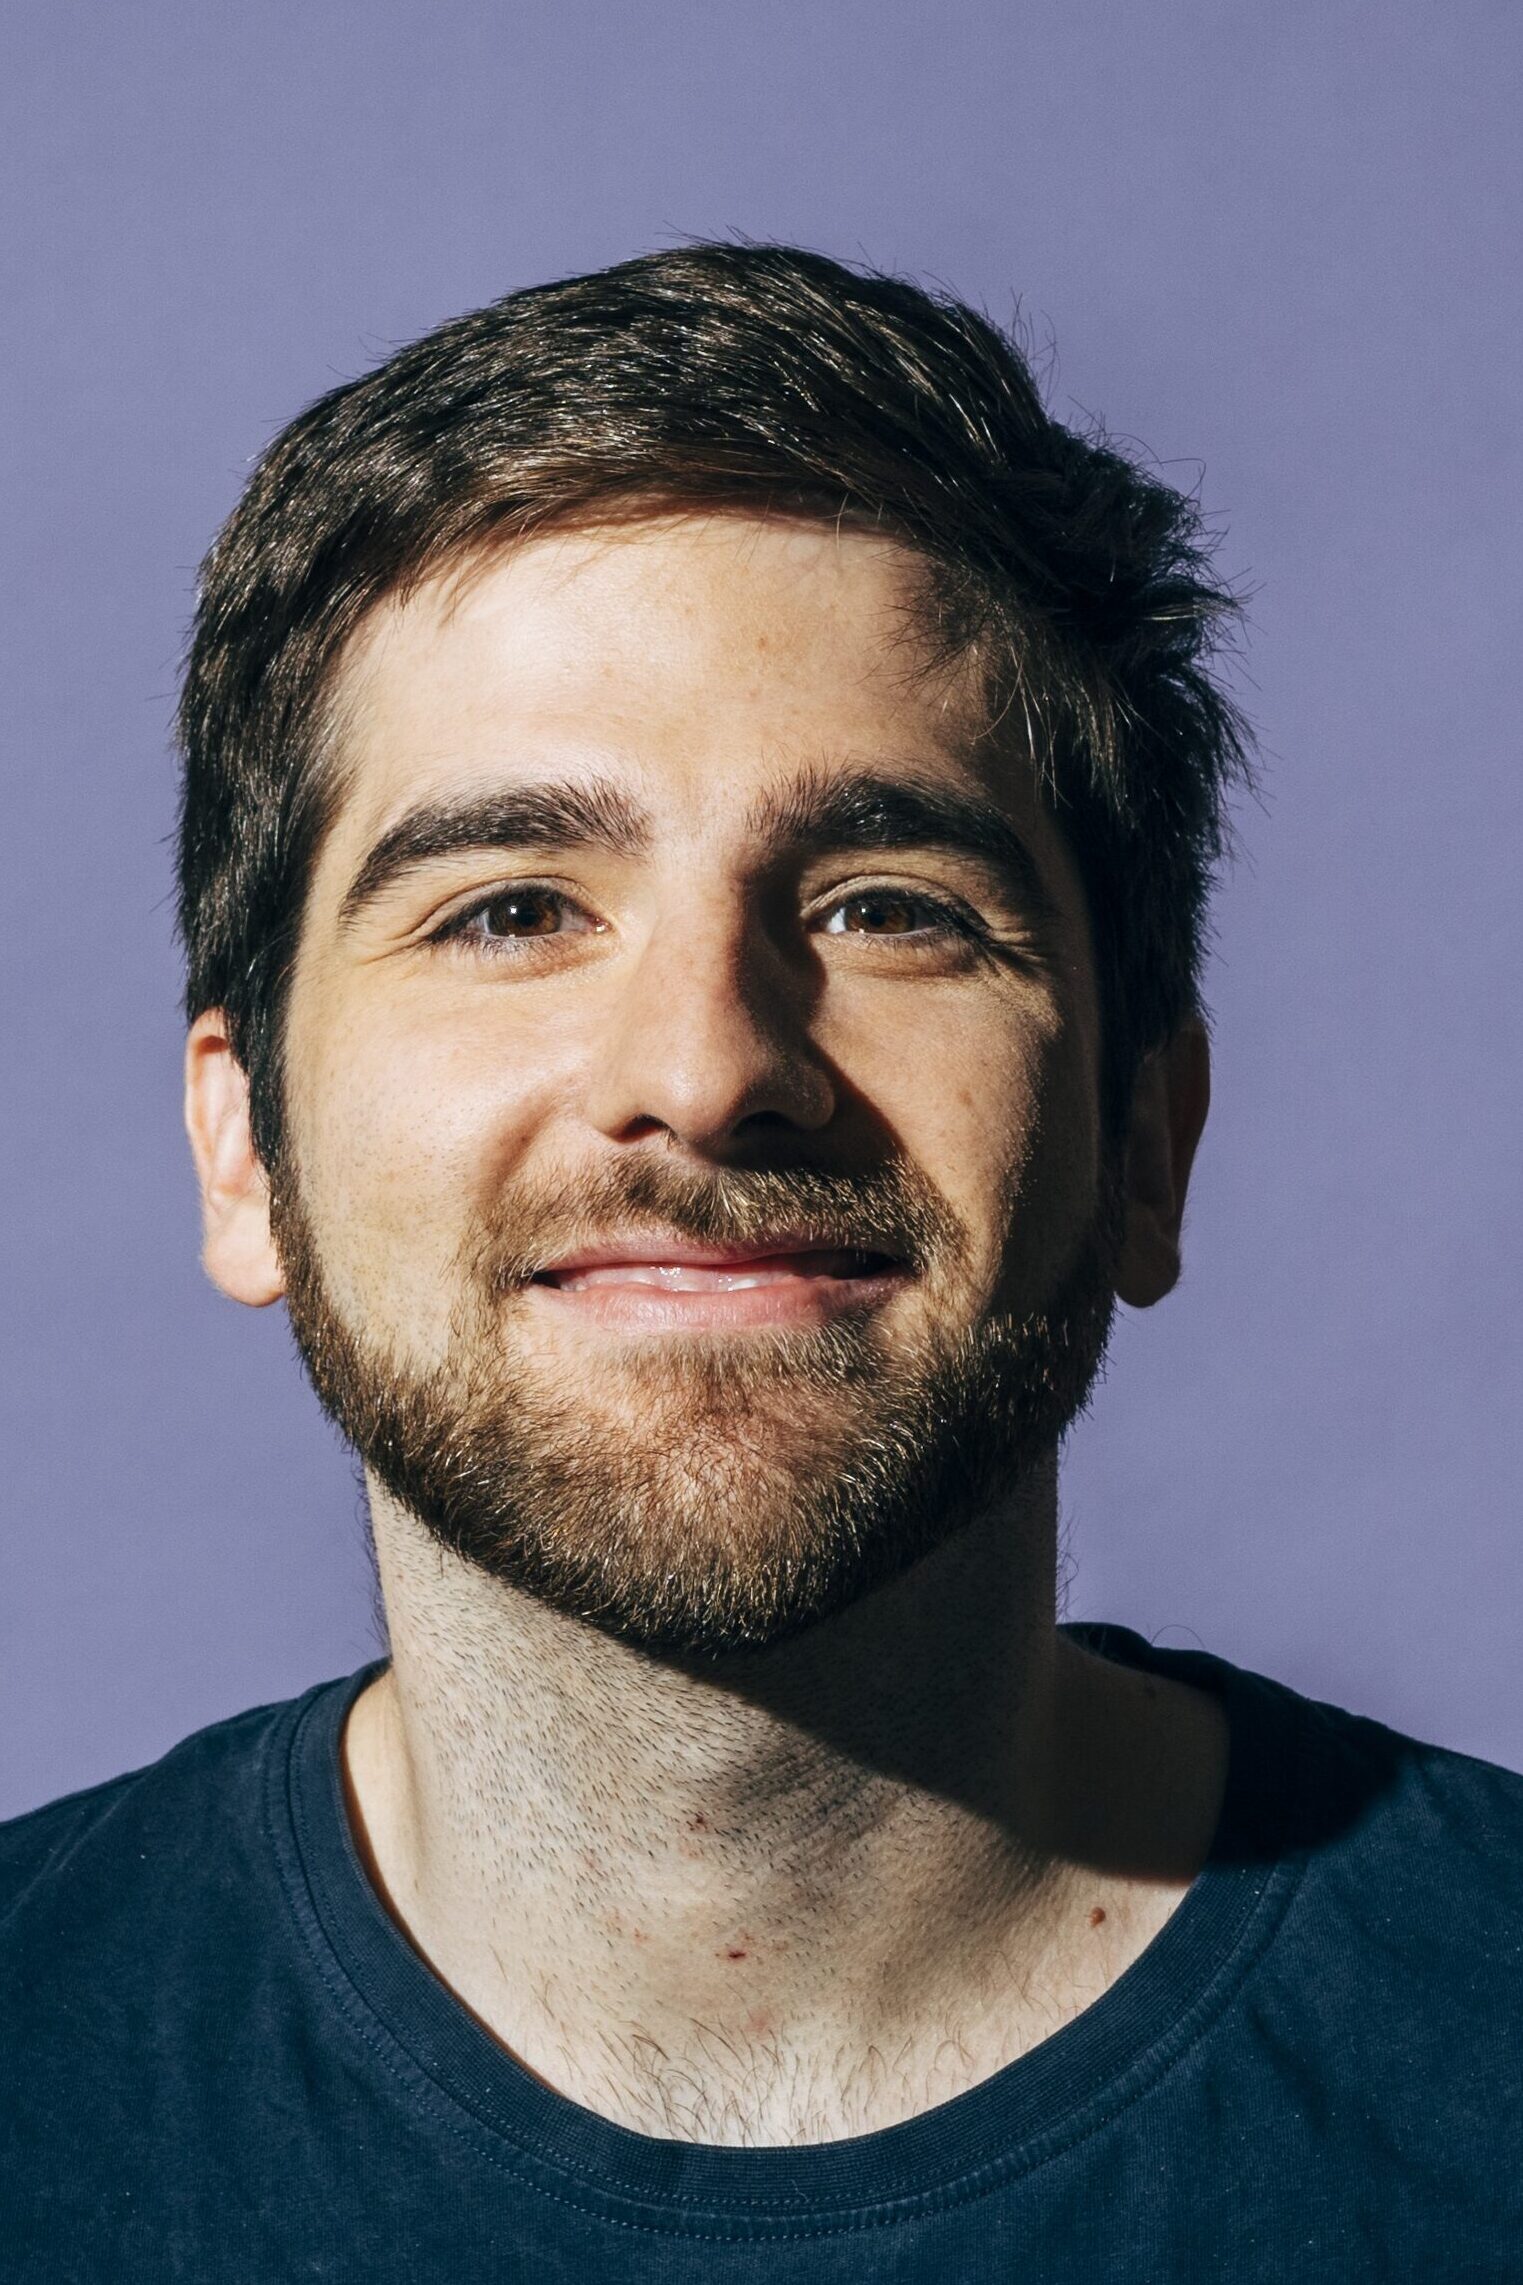
Title: Deep Learning in practice – The struggle to get things to production
Date: 24-Apr-2026 at 13:15
Location: Online via MS Teams
Abstract: Building a machine learning model is easy, training it is harder, but deploying it to a production system is sometimes a long struggle. I will present a case from a recent EIDU development cycle that showcases that training a model is not the end of the job.
Affiliation: EIDU
Bio: After studying Cognitive Science in 2013 – a field covering neuroscience, psychology, linguistics, computer science, and artificial intelligence – Kevin Trebing started a master’s degree in artificial intelligence in 2018. After completing this, he started a job as a Data Scientist in a consultancy where he worked on several projects involving various data science tasks. Since 2024, he has been working at EIDU as a Data Scientist, developing ML models, performing experiment analysis, and providing insights from the millions of data points we receive daily.
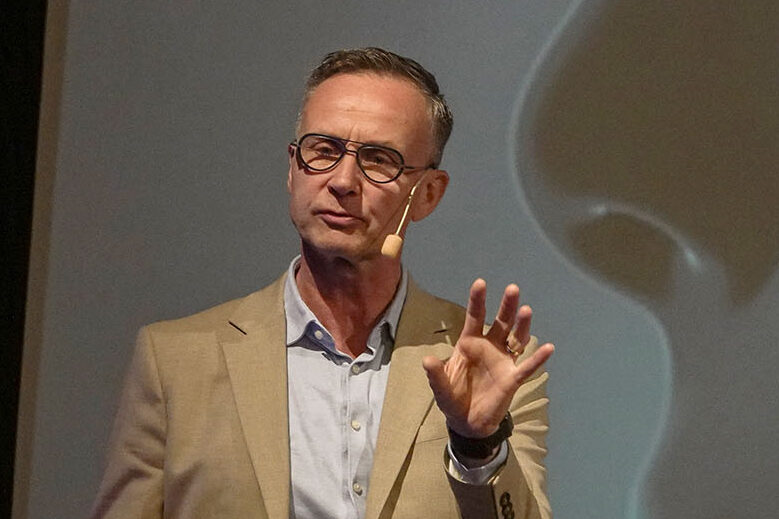
Title: Principles for Effective Data Visualisation: 9.5 Evidence Based-/Based Guidelines
Date: 01-May-2026 at 13:15
Location: BBG 2.23
Abstract: This masterclass introduces students to the fundamentals of effective data visualisation, with a strong focus on how people interpret visual information. Rather than treating visualization as a technical task, the session positions it as a human-centered discipline where perception, cognition, and decision-making play a central role. The presentation combines theory with practical examples and exercises. Students learn how common design choices influence understanding, and how misleading visuals can distort insights. Key principles include starting with a clear purpose, choosing the right chart for the message, avoiding visual distortion, and reducing unnecessary complexity. Through “9.5 practical tips,” the session provides actionable guidance to improve clarity and impact. Topics include the correct use of axes, colour, labels, and chart types, as well as the importance of simplicity and focus. Interactive elements, including visual tests and sketching exercises, help students apply these principles directly.
Affiliation: ABNA AMRO
Bio: Ben de Jong is a data visualisation expert and trainer based in the Netherlands. He helps professionals turn data into clear insights through better chart and dashboard design. At ABN AMRO, he works on ESG data, and through ClearDataViz he trains teams in effective visualisation. He is also the creator of Steef.ai, an AI assistant that supports better design decisions.
Title: Computational Pathology for Real-world Precision Oncology: Improving robustness through inductive biases
Date: 08-May-2026 at 13:15
Location: Online via MS Teams
Abstract: Computational pathology is transforming precision oncology through AI-driven biomarker discovery from gigapixel whole slide images. However, standard deep learning models often lack the robustness required for real-world clinical deployment, easily overfitting to irrelevant artifacts or failing to capture complex biological hierarchies. This talk explores how to overcome these critical failure modes using inductive biases by explicitly integrating domain knowledge to guide models toward true biological signals. We will dive into two technical case studies from Lunit’s AI research:
- OCELOT: Overcoming the disconnect between cell detection and tissue segmentation. We propose a unified, hierarchical model that mirrors how pathologists visually analyze tissue, improving both task performance and biological consistency.
- ScanGen: Eliminating “scanner bias” caused by hardware variations. We introduce a contrastive loss framework that forces foundation models to discard scanner-specific artifacts and learn purely specimen-focused representations.
Attendees will learn how carefully designed inductive biases are essential for building reliable, generalizable AI in healthcare.
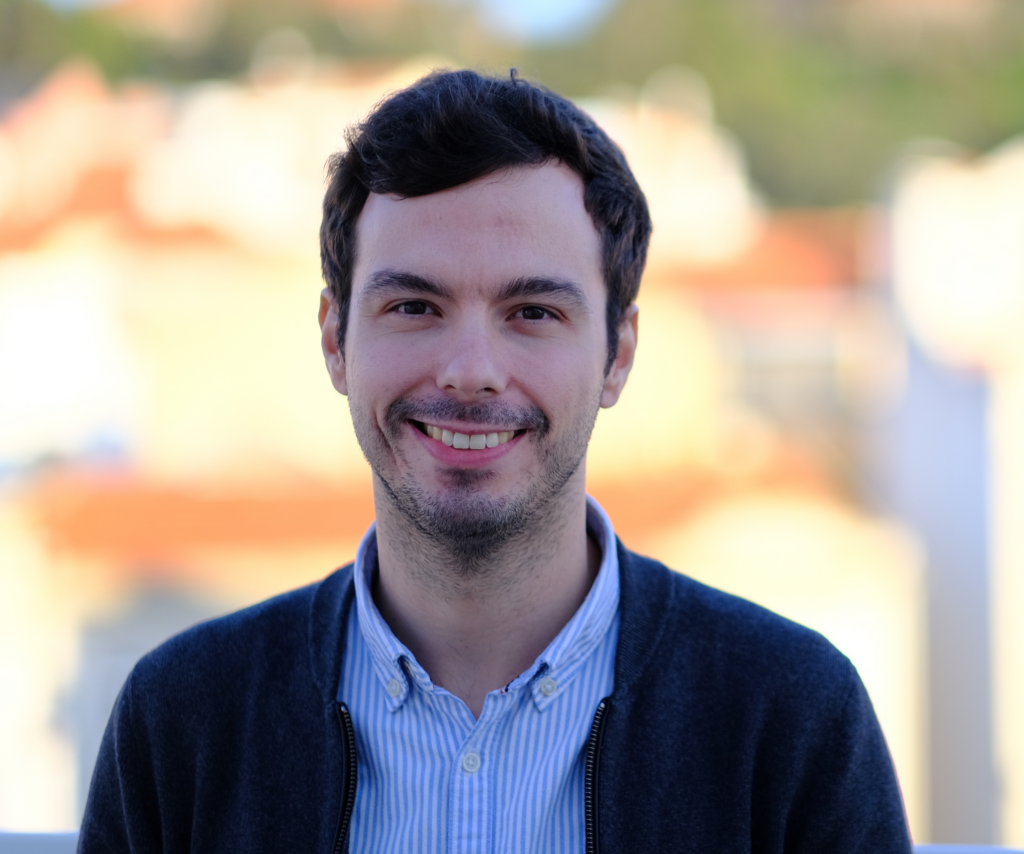
Name: Sérgio Pereira
Affiliation: Lunit Inc.
Bio: Sérgio Pereira is the Head of AI Research, Oncology Group, at Lunit. He leads the team of AI researchers and engineers who build the AI models powering Lunit SCOPE, used in real-world products for oncology and big pharmaceutical partnerships. He has a background in Biomedical Engineering and holds a PhD in computer science, where he researched brain tumor segmentation in MRI. Throughout his academic career, he has authored and co-authored 60+ papers with 15k+ citations.
Title: Stance Detection on Twitter
Date: 11-May-2026 at 13:15
Location: Online via MS Teams
Abstract: This presentation examines methodologies for identifying user positions on polarized issues. Stance detection is defined as inferring a user’s position toward an object of evaluation, such as political candidates or social movements, which is distinct from sentiment analysis. The presentation details three primary approaches: 1) Unsupervised Learning: Employing dimensionality reduction and clustering to identify stances without training data. This approach achieves up to 98% purity using retweet features. 2) Supervised Learning: Training classifiers on labeled data, which achieves around 87% accuracy but is often limited by data requirements. 3) Semi-Supervised Learning: Utilizing “homophily” to propagate labels through retweet networks. This method achieved over 98% accuracy in some case studies by tagging influential users and expanding to the broader network.
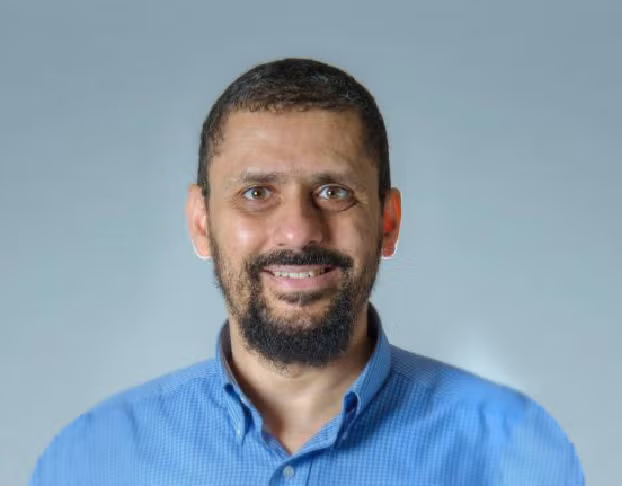
Name: Kareem Darwish
Affiliation: Qatar Computing Research Institute (QCRI)
Bio: Dr. Kareem Darwish is a principal scientist at the Qatar Computing Research Institute (QCRI) where he works on Large Language Models, information retrieval, computational social science, and natural language processing. Kareem Darwish worked as a researcher at the Cairo Microsoft Innovation Lab and the IBM Human Language Technologies group in Cairo. He also taught at the German University in Cairo and Cairo University. His research on natural language processing has led to state-of-the-art tools for Arabic processing that perform several tasks such as part-of-speech tagging, named entity recognition, automatic diacritic recovery, sentiment analysis, and parsing. His work on social computing focused on predictive stance detection to predict how users feel about an issue now or perhaps in the future, and on detecting malicious behavior on social media platform, particularly propaganda accounts. His innovative work on social computing has received much media coverage from international news outlets such as CNN, Newsweek, Washington Post, the Mirror, and many others. Aside from the many research papers that he authored, he also authored books in both English and Arabic on a variety of subjects including Arabic processing, politics, and social psychology.
Title: Selecting Information: The algorithm of my career journey from AI to the next computing era
Date: 22-May-2026 at 13:15
Location: BBG 0.61
Abstract: What do we mean by information, and how do we distinguish it from noise? This question sits at the core of modern science, artificial intelligence, and computing. It has also entirely shaped my own research trajectory. In this lecture, I reflect on a career path spanning explainable AI, scientific machine learning, and quantum‑centric computing, unified by a single theme: information is not a property of data points, but of the probabilistic structures and representations that generate them. Starting from foundational concepts in information theory, I argue that extracting signal is an act of selection. Whether through regression, singular value decomposition, neural representations, or quantum subspace methods, algorithms implicitly choose a coordinate system in which certain structures are preserved and others discarded. These choices determine what we label as “signal” and what we treat as “noise”, ultimately impacting what scientific questions are tractable. Drawing on concrete examples, I show how algorithms are becoming the control layer across heterogeneous systems. In this context, understanding information as relative, model‑dependent, and representation‑driven is a critical skill for the next generation of scientists.
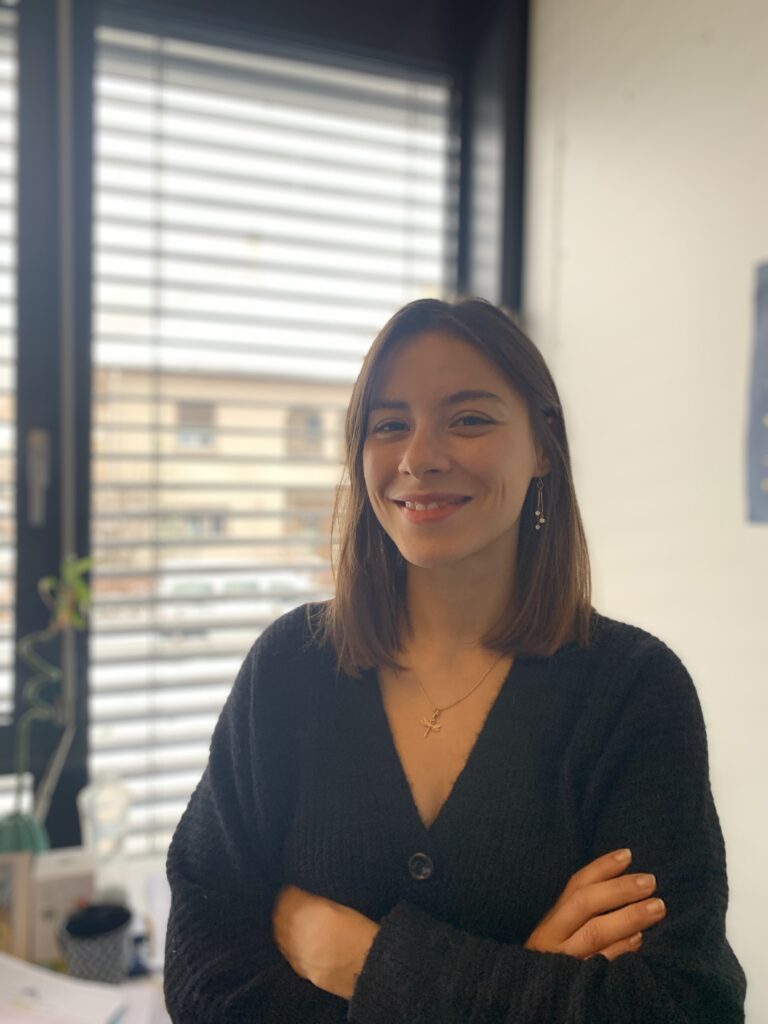
Name: Mara Graziani
Affiliation: IBM Research Europe
Bio: Mara Graziani is a Research Scientist in the Algorithms Design and Applications for Science team at IBM Research Europe. Her work focuses on the design, analysis and discovery of novel algorithms for next-generation computing, particularly at the intersection of Artificial Intelligence and quantum technologies. Her research portfolio includes foundational contributions to artificial intelligence, from the development of multimodal foundation models to their rigorous evaluation in terms of reliability, trustworthiness and uncertainty.
She holds a Ph.D. in Computer Science from the University of Geneva (2021), an M.Phil. in Machine Learning, Speech and Language from the University of Cambridge (2017) and a B.Eng. in Information Technology Engineering from Sapienza University of Rome (2015).
Title: Designing information in the Science-Policy interface
Date: 29-May-2026 at 13:15
Location: BBG 0.61
Abstract: How can complex scientific research be effectively translated into actionable insights for policymakers? At the PBL Netherlands Environmental Assessment Agency, information design is far more than a final aesthetic touch. This presentation explores the intricacies of the science-policy interface, demonstrating how visual storytelling and data visualisation are employed to bring abstract concepts to life and communicate critical messages with clarity. Filip de Blois provides a ‘behind-the-scenes’ look at the PBL methodology, from initial collaborative sketching sessions with researchers to the final delivery of complex data products. Drawing on practical examples and key insights from the book ‘Visualising Knowledge’, this session explores how design can strengthen the dialogue between scientists, policy-makers and the public while maintaining rigorous scientific nuance.

Name: Filip de Blois
Affiliation: PBL Netherlands
Bio: Filip de Blois is an Information Designer at the PBL Netherlands Environmental Assessment Agency. In the book ‘Visualising Knowledge’, Filip and his team share the lessons they have learned through years of producing scientific data visualisations for policymakers. Filip utilises sketching as a core collaborative tool, working closely with researchers to ensure their expertise is distilled into clear, impactful visualisations that resonate within the political sphere.
Title: Robustness of image segmentation models for Radiotherapy and its implications
Date: 05-June-2026 at 13:15
Location: Online via MS Teams
Abstract: In this presentation, I will motivate the need for robustness in image segmentation, with a special focus on applications in radiotherapy. This will form the basis for some recent work on measuring its impact, especially on a clinical level. I will motivate how engineering metrics are very different from what clinicians (usually) care about, and what we should be doing to bridge that gap. Finally, I will demonstrate how all of this comes together in a prototype tool that can potentially improve clinical decision making in the future. I will intersperse some lessons I’ve learnt over the years in the industry and academia, which I hope will help you avoid making mistakes that I did and accelerate your journey towards a fruitful career in data science.
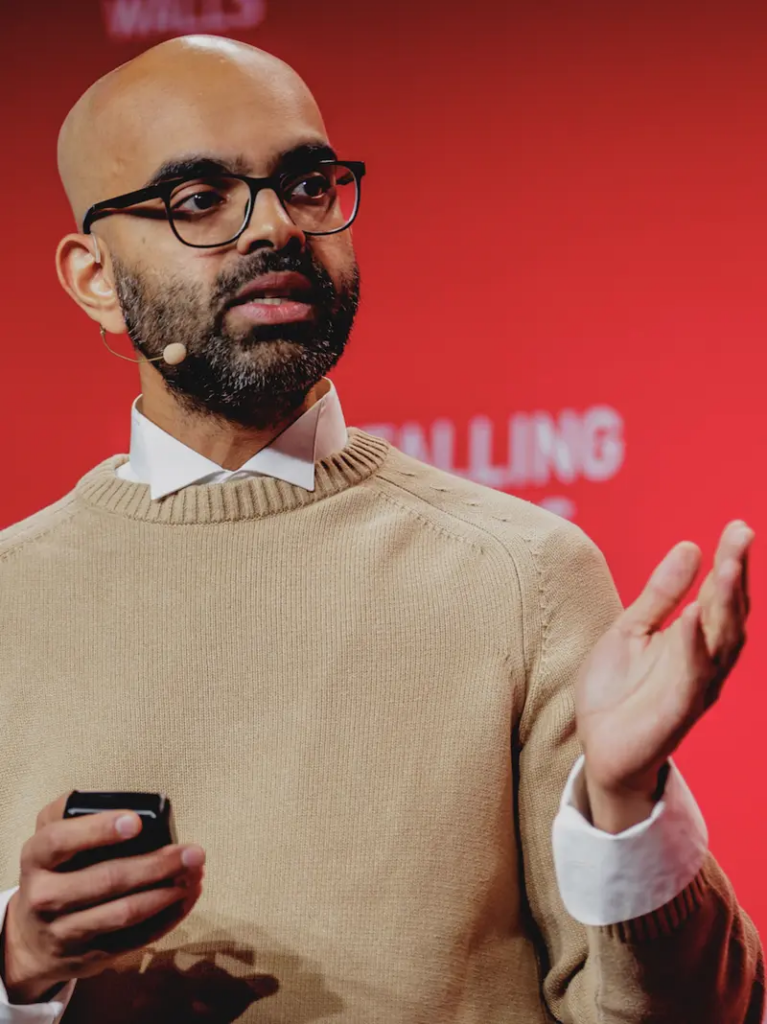
Name: Amith Kamath
Affiliation: ARTORG Center for Biomedical Engineering Research
Bio: My name is Amith, and I am experienced in computer vision, production-grade software design, and clinical imaging applications. I earned a PhD with Prof. Mauricio Reyes at the MIA Lab in September 2025.
Title: AI & ethics: how values guide your decisions
Date: 12-June-2026 at 13:15
Location: BBG 0.01
Abstract: Abstract? No, in this talk, I will show you that ethics does not have to be very abstract. In fact, when applied to a concrete example of AI, you will see that ethics is very practical and useful!
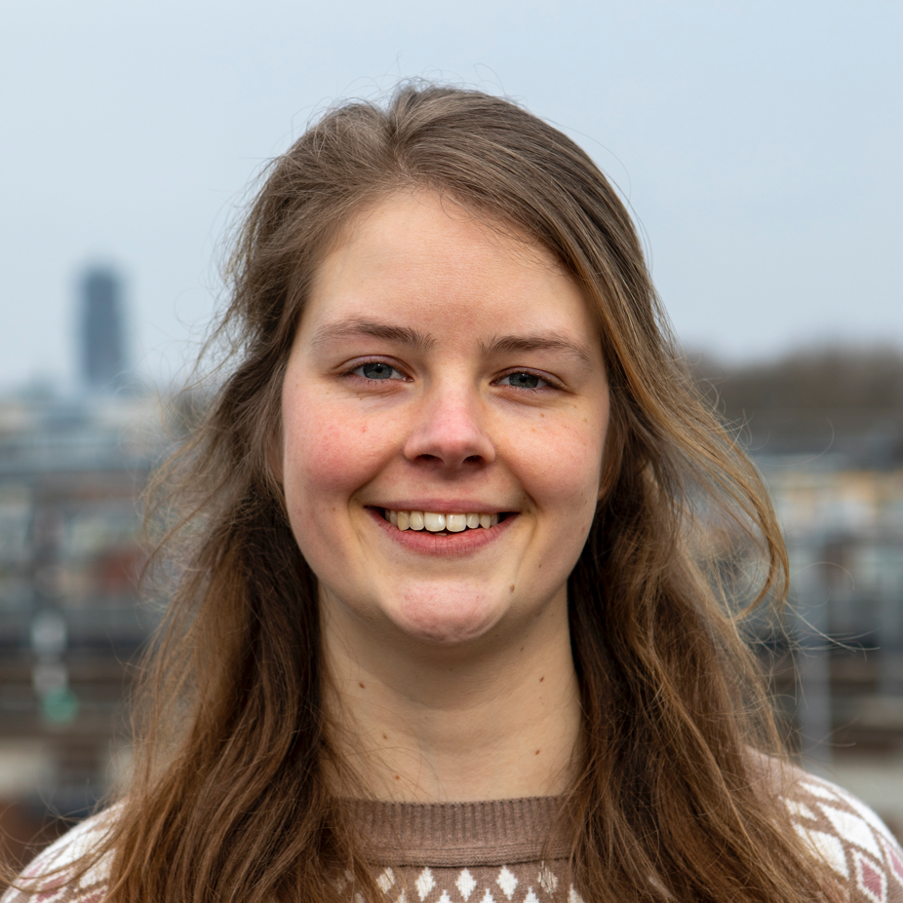
Name: Fenna Woudstra
Affiliation: The Green Land
Bio: Fenna studied Artificial Intelligence in Utrecht, where she graduated in 2022. Her thesis focused on bias and fairness in machine learning algorithms. In 2023 she started working at The Green Land, a data ethics consultancy that helps public organizations to make well-considered decisions in the use of data and AI.